Meeting the City's Greenhouse Gas Emissions Targets In Three Charts
Are we there yet?
By Michael King, Fri., Nov. 1, 2019


The Austin Community Climate Plan projected that local greenhouse gas emissions (measured as "millions of metric tons of carbon dioxide equivalent," or "MmtCO2e") would peak in 2015 (the year the plan was adopted; our actual performance metrics lag a year or two behind).
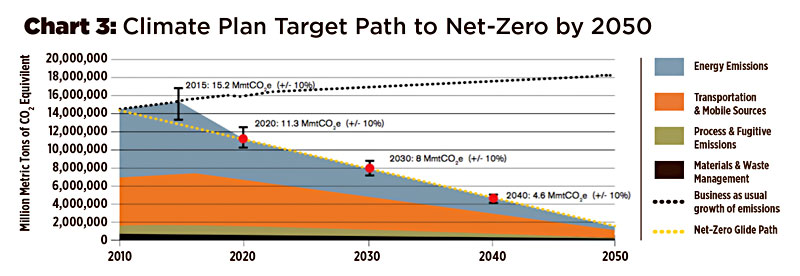
As Chart 3 shows, after that point the plan projected ongoing consistent reductions in energy-related emissions, and then slower but also steady cuts in transportation-related emissions, that would put the city on a "glide path" to net-zero emissions by 2050.

Once the numbers came in, though (Chart 1), the city found that emissions had peaked earlier, around 2011; ongoing shifts toward renewable energy and better resource recovery (recycling, composting, etc.) have helped make Austin one of a handful of global cities where the worst climate-harming excesses appear to be behind us.
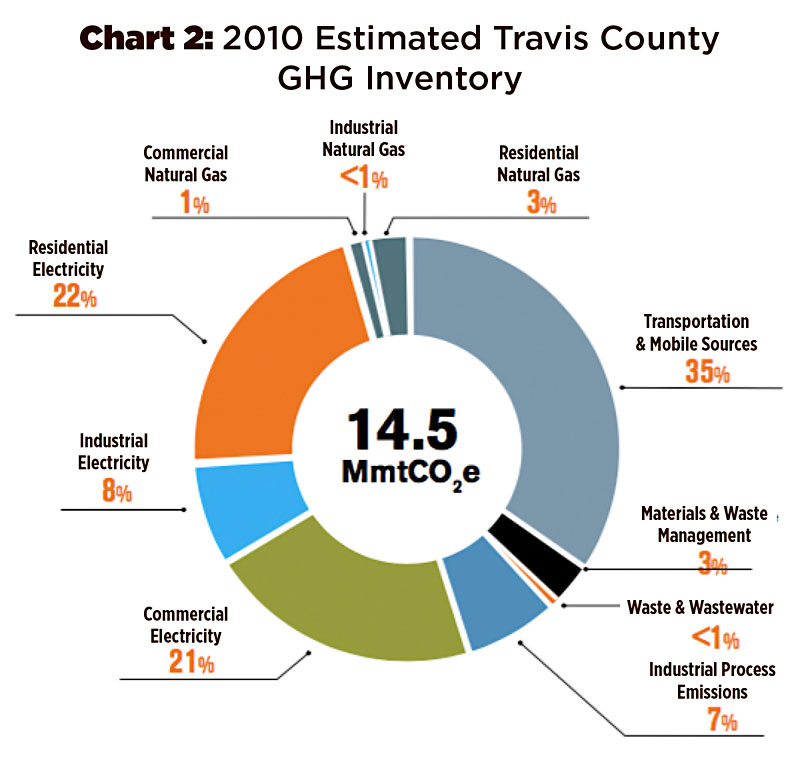
While energy – and primarily electricity generation – remains the largest source of emissions as it was in 2010 (Chart 2), Austin Energy's planned closure of its Decker Creek and Fayette plants is expected to keep Austin on a downward trend through the Community Climate Plan's 2020 and even 2030 interim targets. But meeting that 2030 goal (8 MmtCO2e), and then powering through to net-zero, will require more than anything else changes in mobility – zero-emissions vehicles (including renewable electric), major investments in high-capacity bus or rail systems, and increasingly walkable and transit-friendly land use.
Got something to say on the subject? Send a letter to the editor.