Crunching the Numbers
Fri., June 10, 2016


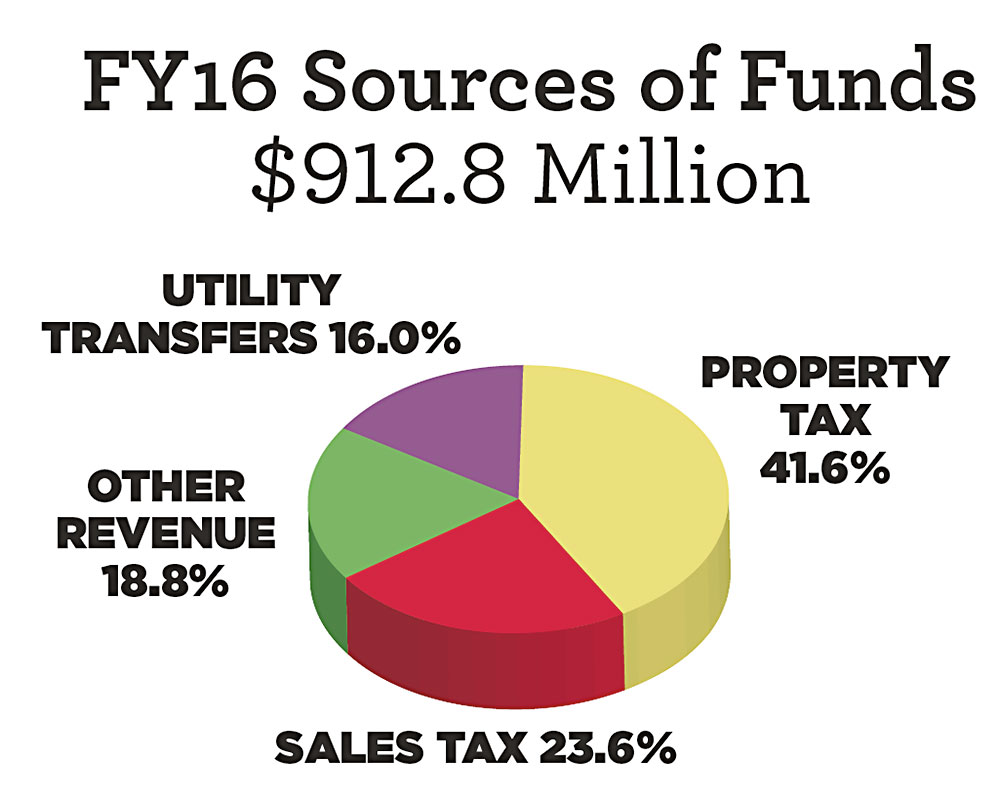
2016 Revenue Sources
General Fund Total: $912.8 Million
The current major sources of "General Fund" (operating) revenue include property taxes, sales taxes, transfers from Austin Water and Austin Energy, and miscellaneous fee income (development, permits, etc.). The share of revenue provided by property taxes has grown from 30% to 41.6% since 2005-06, while the share from utility transfers has shrunk, as previous councils have capped that source. Sales taxes are the most volatile and unpredictable source, and budget staff is warning Council that sales taxes might not meet levels anticipated in the adopted FY 2016 budget.
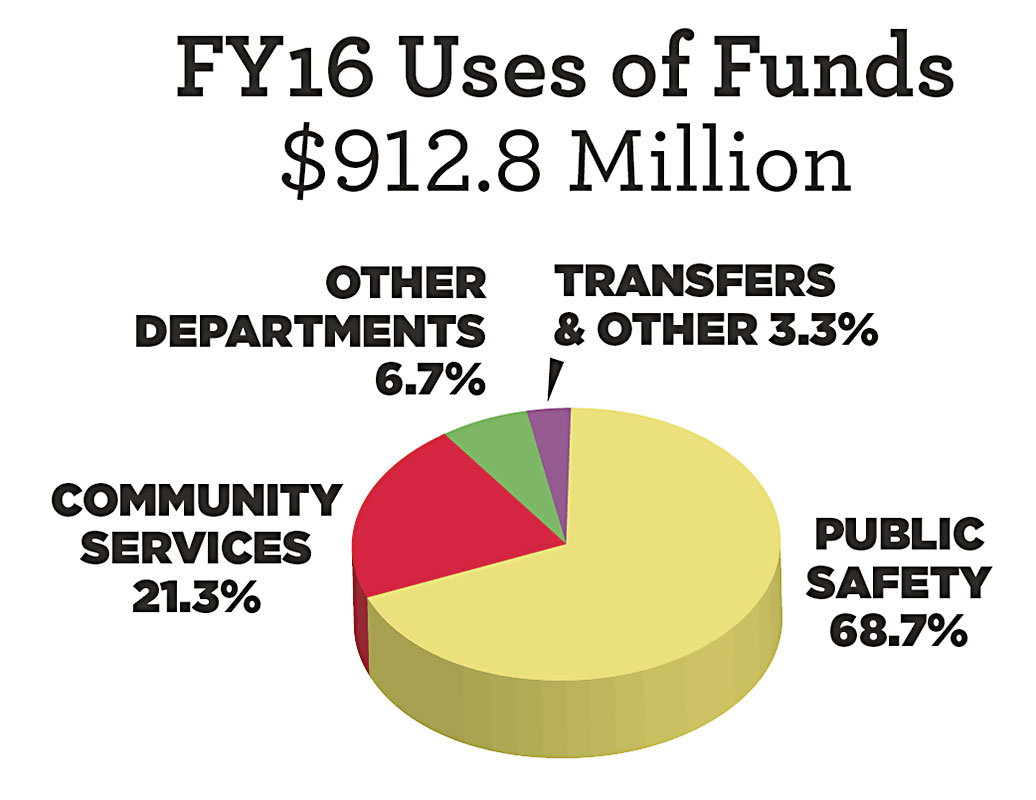
2016 Expenditures
General Fund Total: $912.8 Million
Nearly 69% of all spending in FY 2016 goes to public safety departments. "Community Services" (21.3%) includes Parks and Recreation, Libraries, Animal Services, Health and Human Services, Neighborhood Housing and Community Development. "Other departments" includes Municipal Court (arguably belonging as well to public safety), planning and zoning, and development services. The General Fund covers the city's operating expenses, and does not include the "enterprise" (self-supporting) departments, such as Austin Energy, Austin Water, Aviation, Convention Center, etc.

Where Your Property Taxes Go
AISD $2,729
City of Austin $1,087
Travis County $841
ACC $248
Central Health $237
Total $5,142
This chart breaks down the tax bill for FY 2016 for a "median household" (home value $220,000), carrying a homestead exemption but not a senior or disabled exemption. More than half of your property tax bill goes to public school taxes.
Income Inequality in Austin, by Council District

These two charts reflect the overall economic segregation of Austin. In general, much higher poverty rates occur in the eastern districts (1-4) than in the more western districts (5-10). District 9 is an anomaly, due to the large number of student residents who are technically below the poverty line. The income chart more accurately reflects the range of wealth from east to west across the city, with $35,000/yr per family at the low end (District 3) and $128,000 for families at the high end. Council is considering an expansion of the 6% property tax homestead exemption adopted last year, which most greatly benefits wealthier families owning more expensive homes.
Got something to say on the subject? Send a letter to the editor.