Otherwise Like-Minded Voters Split on Prop. 2
Proposition 2 created a big divide among voters who typically agree on most things
By Lee Nichols, Fri., Nov. 14, 2008


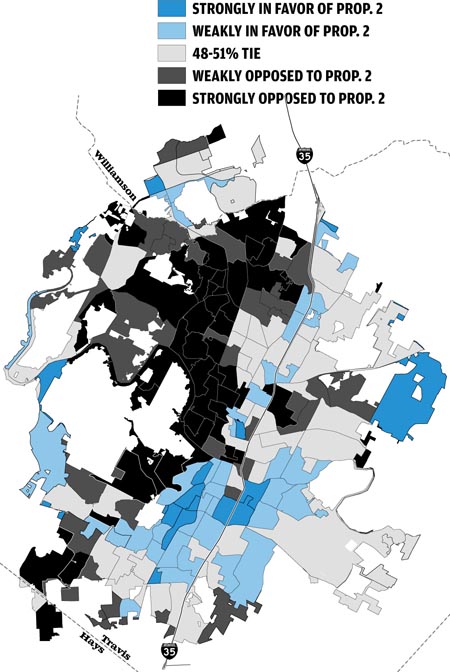
The most notable feature of the Proposition 2 vote was the closeness. Overall, the "nays" only took 52% – a margin of just 10,164 votes out of more than a quarter-million cast. It seemed that any group of politically minded Austinites that got together before Election Day, even if they normally fell on the same side of the political coin, had a split opinion on this one.
In reviewing the precinct-by-precinct results, it was striking how, rather than the normal geographic splits common in other races, this one had a plethora of evenly split neighborhoods. We decided to reflect this split opinion with an unusual take in this map: Rather than showing a straight up or down decision for each precinct, we painted the close ones (those where the totals ranged from 48.00% to 52.00%) all in one color. For the rest, we showed our more common shadings of weakly (52.01%-55.00%) or strongly (more than 55%) supportive or against.
A surprising 55 precincts fell into the "even" category, and with no real geographic uniformity. Ultimately, Prop. 2's biggest problem was that it came out behind in raw number of precincts that favored it. Thirty-nine were weakly supportive, and a mere 19 were strongly in favor – and many of the latter were precincts that didn't yield a lot of votes. On the flip side, 31 were weakly against, and 57 came out strongly against.
The Extremes
(Precincts where vote differential was greatest.)
| Precinct | For | Against | Margin | Winning% |
| 148 | 1,951 | 1,500 | 451 | 56.5% |
| 420 | 969 | 716 | 253 | 57.5% |
| 461 | 1,193 | 948 | 245 | 55.7% |
| 342 | 1,775 | 1,544 | 231 | 53.5% |
| 352 | 1,530 | 1,314 | 216 | 53.8% |
| 460 | 1,082 | 866 | 216 | 55.5% |
| 136 | 1,599 | 1,390 | 209 | 53.5% |
| 332 | 1,084 | 875 | 209 | 55.3% |
| 440 | 988 | 804 | 184 | 55.1% |
| 433 | 733 | 558 | 175 | 56.8% |
| 354 | 1,289 | 1,687 | -398 | 56.7% |
| 214 | 460 | 862 | -402 | 65.2% |
| 249 | 817 | 1,242 | -425 | 60.3% |
| 347 | 1,123 | 1,571 | -448 | 58.3% |
| 231 | 761 | 1,219 | -458 | 61.6% |
| 253 | 815 | 1,286 | -471 | 61.2% |
| 337 | 833 | 1,364 | -531 | 62.1% |
| 256 | 686 | 1,226 | -540 | 64.1% |
| 345 | 690 | 1,241 | -551 | 64.3% |
| 367 | 1,567 | 2,211 | -644 | 58.5% |
Note that in Prop. 2's strongest precincts, the margin was often modest, but in its weakest ones, Prop. 2 was beaten more soundly. In the 10 boxes that provided the greatest vote differential, Prop. 2 won by 2,389 votes, and it didn't hit 58% in any precinct. In the 10 precincts where it gave up the most votes, it lost by 4,868 votes and a better than 61%-39% margin.
Power Boxes
| Precinct | For | Against | Margin | Total Votes |
| 367 | 1,567 | 2,211 | -644 | 3,778 |
| 148 | 1,951 | 1,500 | 451 | 3,451 |
| 342 | 1,775 | 1,544 | 231 | 3,319 |
| 366 | 1,491 | 1,735 | -244 | 3,226 |
| 328 | 1,371 | 1,750 | -379 | 3,121 |
| 349 | 1,479 | 1,525 | -46 | 3,004 |
| 136 | 1,599 | 1,390 | 209 | 2,989 |
| 354 | 1,289 | 1,687 | -398 | 2,976 |
| 242 | 1,516 | 1,445 | 71 | 2,961 |
| 352 | 1,530 | 1,314 | 216 | 2,844 |
| 266 | 1,398 | 1,314 | 84 | 2,712 |
| 347 | 1,123 | 1,571 | -448 | 2,694 |
| 406 | 1,331 | 1,317 | 14 | 2,648 |
| 360 | 1,283 | 1,271 | 12 | 2,554 |
| 350 | 1,287 | 1,219 | 68 | 2,506 |
| 277 | 1,289 | 1,172 | 117 | 2,461 |
| 355 | 1,257 | 1,181 | 76 | 2,438 |
| 262 | 1,088 | 1,342 | -254 | 2,430 |
| 429 | 1,257 | 1,097 | 160 | 2,354 |
| 218 | 1,020 | 1,315 | -295 | 2,335 |
Among the Top 20 "power boxes" – those with the most voters – Prop. 2 actually won 12. But again: The victories here were modest (average win: 142 votes), while the failures tended to be more spectacular (average loss: 339).
Got something to say on the subject? Send a letter to the editor.